Problem Statement
Let's consider stock prices as an example of a log-normal distribution.
Let's consider stock prices as an example of a log-normal distribution.
Suppose the daily returns of a stock follow a normal distribution with:
Since stock prices cannot be negative, the actual stock price follows a log-normal distribution.
Using the log-normal probability formula:
P(X > x) = 1 - Φ((ln(x) - μ) / σ)
For x = 1.5:
Z = (ln(1.5) - 0) / 0.2 ≈ 2.02
From the Z-table, the probability of a value being less than 2.02 is 0.9783.
Thus, the probability of the stock price being greater than 1.5 times the mean:
P(X > 1.5) = 1 - 0.9783 = 0.0217
So, 2.17% of the time, the stock price will be greater than 1.5 times its mean.
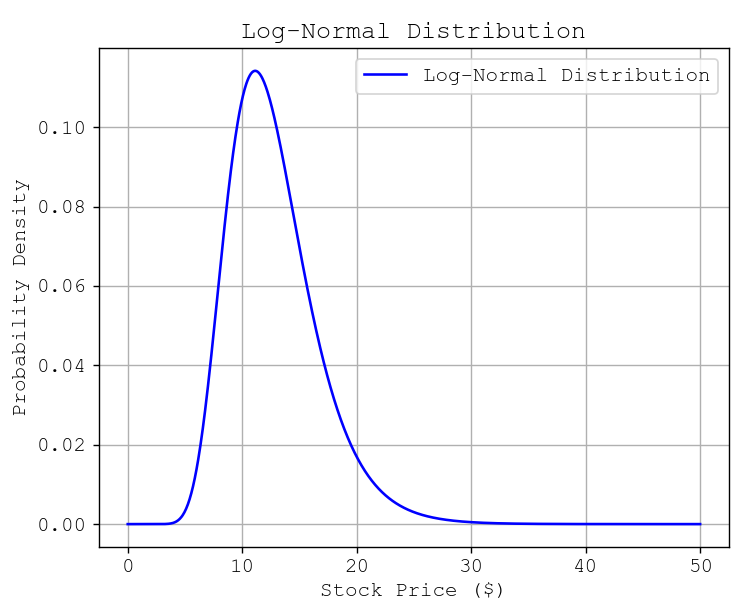
The log-normal distribution curve for this example would look like:
📈 Skewed Distribution Representation