Problem Statement
Let's consider human heights as an example of a normal distribution.
Let's consider human heights as an example of a normal distribution.
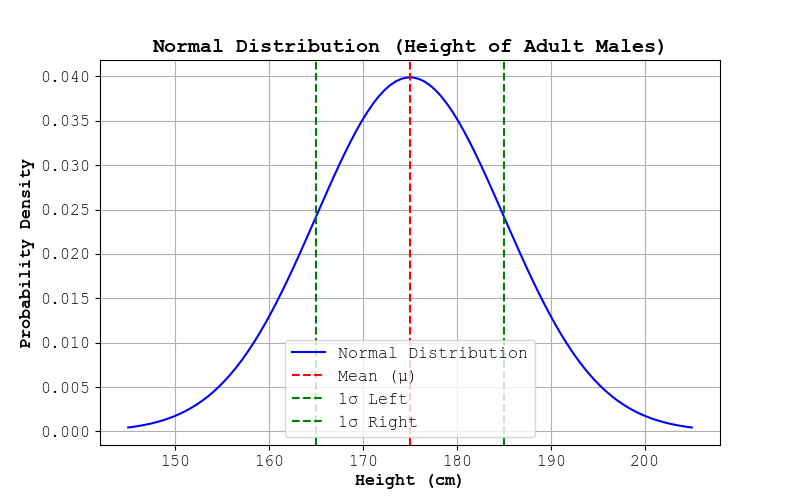
Suppose the heights of adult males in a population follow a normal distribution with:
Using this, we can calculate probabilities, percentiles, and visualize the distribution.
Using the Z-score formula:
Z = (X - μ) / σ
Z = (185 - 175) / 10 = 1.0
From the Z-table, the probability of a value being less than 185 cm is 0.8413.
Thus, the probability of a height greater than 185 cm:
P(X > 185) = 1 - 0.8413 = 0.1587
So, 15.87% of people are taller than 185 cm.
The normal distribution curve for this example would look like:
📈 Bell Curve Representation