Problem Statement
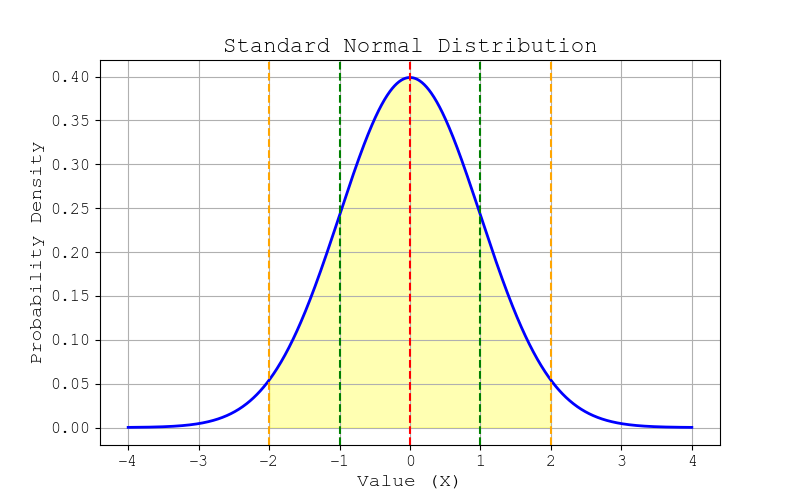
Let's consider the Standard Normal Distribution, a normal distribution with:
- Mean (μ) = 0
- Standard deviation (σ) = 1
This distribution is commonly used in statistics for probability calculations and hypothesis testing.
Let's consider the Standard Normal Distribution, a normal distribution with:
This distribution is commonly used in statistics for probability calculations and hypothesis testing.
For a standard normal distribution, the Z-score is calculated as:
Z = (X - μ) / σ
Z = (2 - 0) / 1 = 2
The Z-score is 2, meaning the value 2 is 2 standard deviations above the mean.
From the Z-table, the probability of a value being less than 2 is:
P(X < 2) = 0.9772
This means there is a 97.72% chance that a randomly selected value is less than 2.
The standard normal distribution curve would look like:
📈 Bell Curve Representation